June 26, 2026
As this essay goes to publication, the Strait of Hormuz has reportedly reopened. Following a memorandum of understanding reached in mid-June, the United States lifted its naval blockade and Iran committed to ensuring normal ship traffic through the Strait, toll-free, for the next sixty days. Tankers are moving again — more than 12.5 million barrels passed through in a single night this week.
Whether this holds is genuinely uncertain. What is being called peace in Washington is being described as something closer to a pause in Tehran.
For this essay, the reopening changes the tense of the question, not the question itself. Even if the Strait stays open, the months it was closed already extracted a real cost from the global economy — a cost that did not land evenly. Three essays ago, this series asked how the world stores oil for emergencies like this one. The two that followed asked how long reserves can last and what reopening might require. One question hasn’t been asked directly yet: of everything this crisis cost, who actually paid — and was the cost distributed anything close to fairly?
The data says no.
A note before going further: this essay leans more heavily on statistics and institutional reports than anything else in this series so far. That’s intentional, not accidental. The Hormuz and Oil Dependency essays were mostly about mechanics — how reserves work, how batteries are built. This one is about consequences, and consequences are best measured, not just described. The numbers below are the foundation the rest of the Energy Policy series will build on. It’s worth sitting with them, even if a few blur together on a first read.
How It Started
The sequence of events is documented and worth stating plainly before looking at the cost. U.S. and Israeli strikes on Iran preceded Iran’s closure of the Strait of Hormuz and retaliatory strikes on energy infrastructure in neighboring Gulf states. In the months that followed, the United States also imposed a naval blockade on ships attempting to reach Iranian ports.
The Uneven Map of Exposure
The same closure affected every economy differently, and the difference comes down to a handful of structural factors: how much energy a country imports versus produces domestically, how deep its financial reserves run, and how exposed its broader economy is to swings in global commodity prices.
The International Monetary Fund’s revised 2026 growth forecasts, released in April, illustrate the gap with real numbers. Iran’s outlook saw one of the largest downward revisions of any country in the world — an initially modest growth forecast cut by more than seven percentage points into a projected economic contraction of over six percent. Saudi Arabia’s forecast was lowered from 4.5 percent growth to 3.1 percent. The broader Middle East and North Africa region had its 2026 outlook cut by nearly three points to just over one percent growth.
The eurozone’s forecast slowed from 1.4 percent to 1.1 percent — a real hit, but a comparatively modest one. The United States, by contrast, saw what the IMF itself described as only a slight downgrade, with growth still projected at 2.3 percent for the year. Global growth overall was revised down to 3.1 percent from an earlier forecast of 3.3 percent.
What the Crisis Is Costing, Globally
Independent economic analyses converge on the same basic picture even where their specific figures differ. The Institute for Economics and Peace puts the world economy’s annual loss from the prolonged conflict at roughly $2.2 trillion, with losses ranging from $1.3 trillion under a partial reopening of the Strait to $3.5 trillion should the underlying conflict resume in full. A separate model from SolAbility, tracking the crisis across more than five dozen national economies, estimates total global GDP losses ranging from roughly $2.4 trillion in an optimistic early-reopening scenario to nearly $7 trillion under full escalation.
Federal Reserve research out of Dallas estimated that a closure removing roughly 20 percent of global oil supply could lower global GDP growth by close to three percentage points in a single quarter, with the average price of West Texas Intermediate crude rising to roughly $98 a barrel. Even under a hypothetical reopening, the same research projected global GDP would likely remain measurably below its pre-closure trajectory well into 2027. The damage does not fully reverse the moment the waterway reopens.
The Long Tail: Fertilizer and Food
The most visible effects of this crisis — oil prices, fuel costs, market volatility — get the headlines. A slower, less visible effect is moving underneath: fertilizer.
Roughly a third of the world’s seaborne urea and phosphate fertilizer supply normally moves through or near the Gulf region. With that supply badly disrupted, the United Nations Food and Agriculture Organization has warned the consequences won’t be confined to higher prices today. Fertilizer that arrives weeks or months late during a planting season cannot simply be applied later — a missed application window means reduced yields or, in some cases, abandoned planting altogether. The disruption beginning now is expected to show up as reduced harvests well into 2027, long after headlines about the Strait itself have moved on.
The countries most exposed to this slower-moving consequence are, again, not evenly distributed. Import-dependent nations across Africa, Asia, and parts of the Middle East — many already managing food insecurity, economic fragility, or climate-related stress — are positioned to absorb the worst of it. The World Food Programme has projected that an additional 45 million people could face hunger by the end of 2026 if the underlying conflict continues. Crop yields in major agricultural exporters including India and Brazil are already projected below normal for the year.
The Pattern Underneath the Numbers
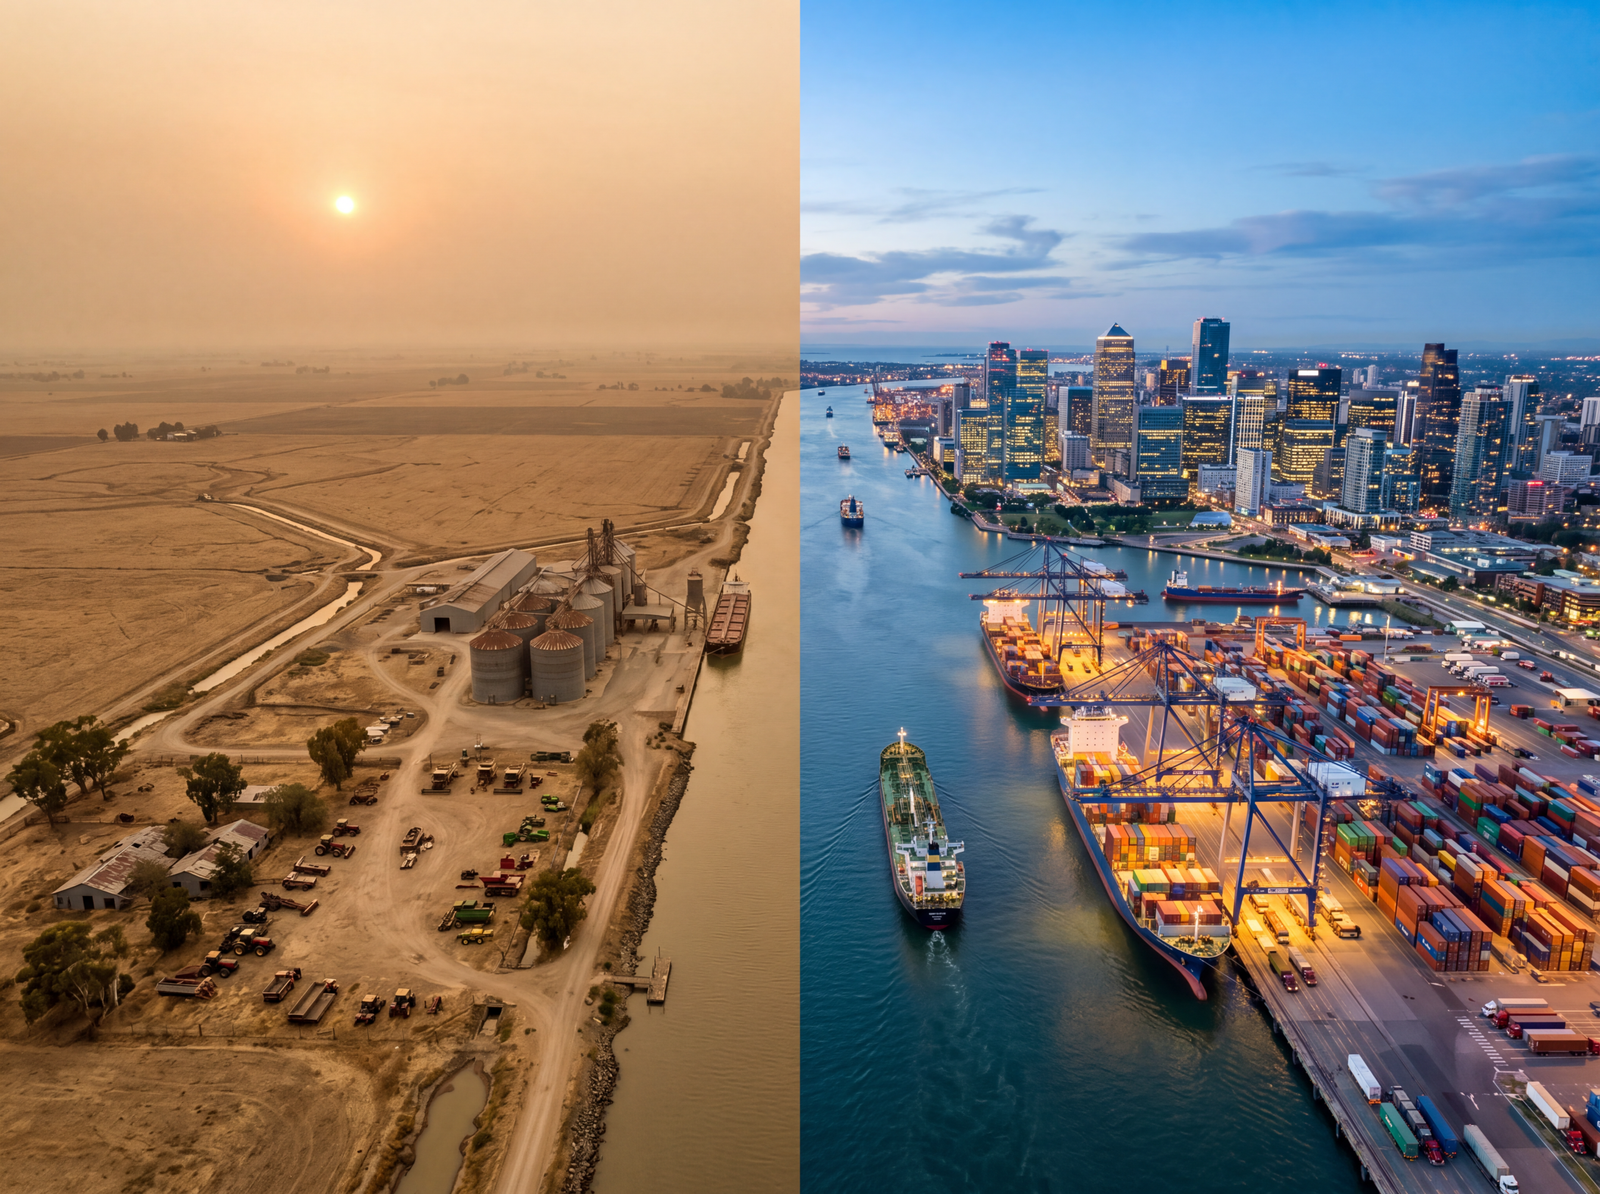
Step back from any single statistic, and a consistent pattern runs through nearly all of this research: the costs of this crisis are not landing evenly. The country least affected in the short term, by the IMF’s own numbers, is the United States.
One additional finding buried inside several of these economic models deserves attention on its own: nations that had already invested in domestic renewable energy capacity before the crisis were found to be measurably less exposed to the shock than nations still dependent on imported fossil fuels. That is not a matter of opinion. It is a finding embedded directly in the economic modeling.
That single fact is the thread the rest of this series will follow. The essays ahead in Energy Policy will look closely at what specific government decisions — incentives, regulations, investment choices — are driving some nations toward that kind of insulation, and what decisions are leaving others exposed.
In Plain Terms
This crisis cost some countries far more than others, and the gap wasn’t random. Nations that had already invested in their own clean energy generation came through measurably better than those still leaning on imported oil and gas. The United States, despite being central to the conflict, absorbed comparatively little short-term damage. What separated the countries hit hardest from the countries that weathered it came down to policy decisions made years before the crisis ever began — and that is exactly where this series turns next.